Weather Data Visualizations Project
This is my first individual attempt of a website created for a class assignment. Weather infomation from around 500 to 600 random cities are extracted from an accessible API. This is to demonstrate capability in performing an API calls with Python. Next, by using Python Pandas library compiling those datas into csv files and pandas dataframes for easier processing. Third step, using matplotlib library, creating several graphs for more intuitive visual analysis. The graphics on this site is the results of that step.
The accessibility of this API is lmited to a certain point, the current datetime when it was called. Past data is behind a paywall in which this student is unwilling to pay.
Furthermore, if an API call bring over 60 results in one minute, it would locked the user until a lengthy period is passed, which this student is unwilling to wait since time is a scarce resource.
These dataset is used for at least three projects, to maintain consistency, only the data a single date is used.
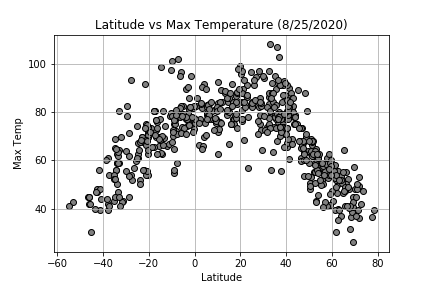
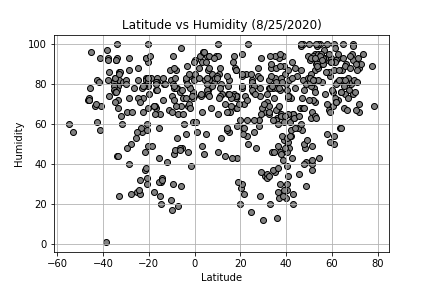
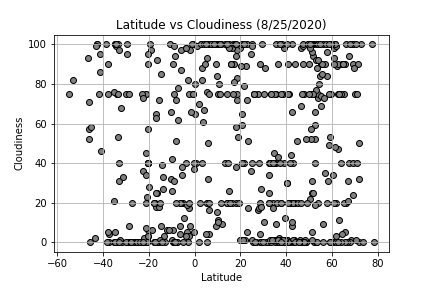
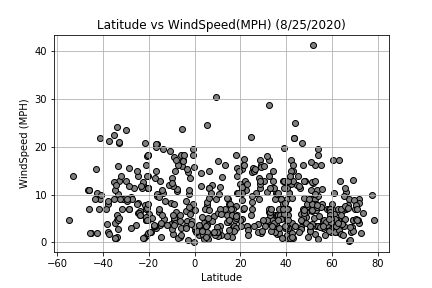
Original Weather Data came from Open Weather API accessed on 8/25/20.The image of the two people in the rain came from Wikimedia Commons.
I put because it look good, it is free and tell the overall story better than my graphs. The artist who made this Tomas Castelazo. © Tomas Castelazo, www.tomascastelazo.com/ Wikimedia Commons/ CC BY-SA 3.0 .
I am not paid by or pay OpenWeatherAPI or the artist and greatly grateful for their generousity.