Max Temperature
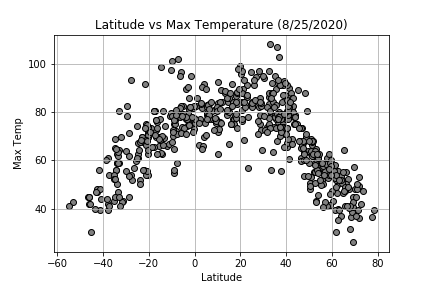
A scatterplot for the Cities to find a relation between their Max Temperature and their location. The analysis, further away for 0° Latitude, the lower the temperature. Heat rose like an arrow-shape toward 20°-40° Latitude.