Past Projects
Jersey City Stations

Jersey City Bikes is a bootcamp project to get started with Tableau to see how we create dashboard for practical real world usage.
Not much to be said about it, since the data are already cleaned, but that Tableau is very lovely, time-saving tool for creating nice visualization.
Skills used: Tableau, GIS
Data Visualization Code Long ExplanationWeather Project
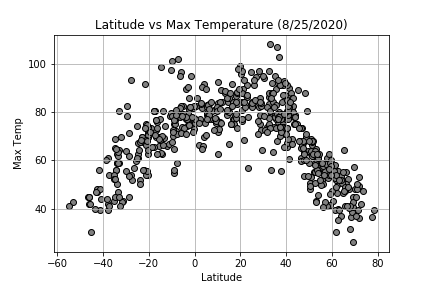
Pull the data from hundreds of cities all around the world and host them on a website. The first website I built with CSS. I learn a lot about building multi-page website and how API works.
Easier ways to create a website existed. But I have a fun time learning the skills to customize it.
Skills used: Python (Panda, Matplotlibs, Scipy), API calls, Linear regression, CSS, JavaScript (Bootstraps 4)
Data Visualization Code Long ExplanationPokeTree

In this project, my main contribution is a hierarchical chart. Search a pokemon (all lowercase), a move, skill or an ability and learn about it.
It could be very useful for hosting or looking up any topics in hierarchical classifications or organizations.
Skills used: ETL from an API using Javascript: D3 library.
Data Visualization Code Long ExplanationOthers
In Progress
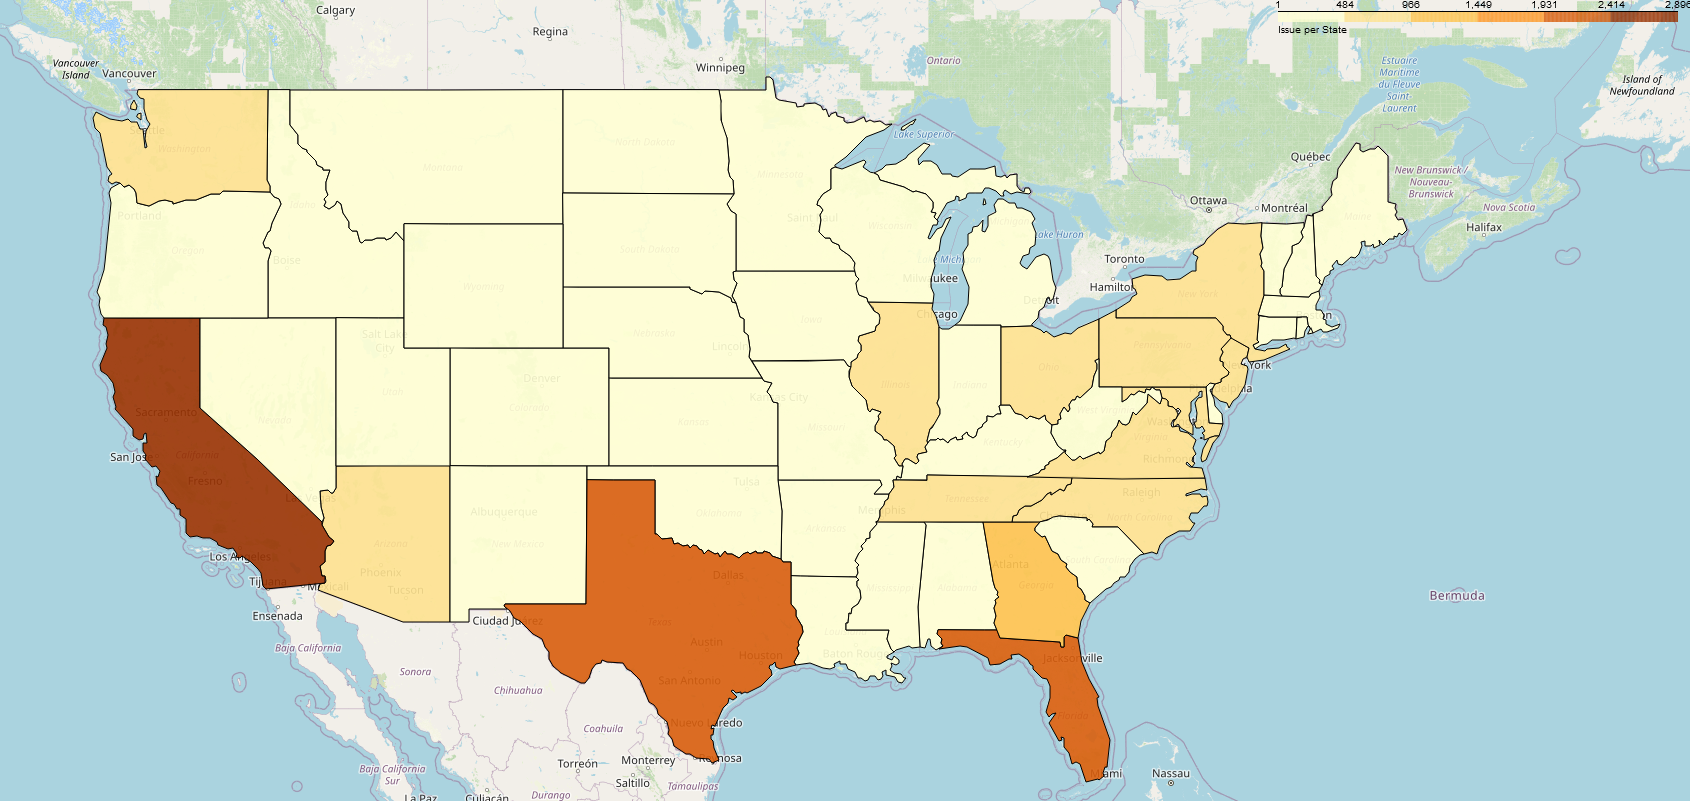
A massive dataset are available from the Consumer Financial Protection Bureau, I decided to play with to use for machine-learning, Chatgpt and learning new skills
Skills used: Pythons (Folium, Seaborn, Panda, Python, Geocoder, Sklearns, Matplotlibs), API calls, GIS. Microsoft PowerBi (expected). Chatgpt prompt
Link to CurrentGeorgia Tech Bootcamp

There are many more projects that I have done in Georgia Tech Bootcamp that I haven' t yet organize or upload to this website. Some dependencies and visualization required liveserver.
Other skills not mentioned: AWS, Hadoop, Flask, NoSql, Mongodb, Sqlite, R, Web-Scraping, Leaflet, GoogleApi, VBA scripting, Postgres..
Github Repositories