Data Visualizations
_________________________
Individual
Jersey City Stations
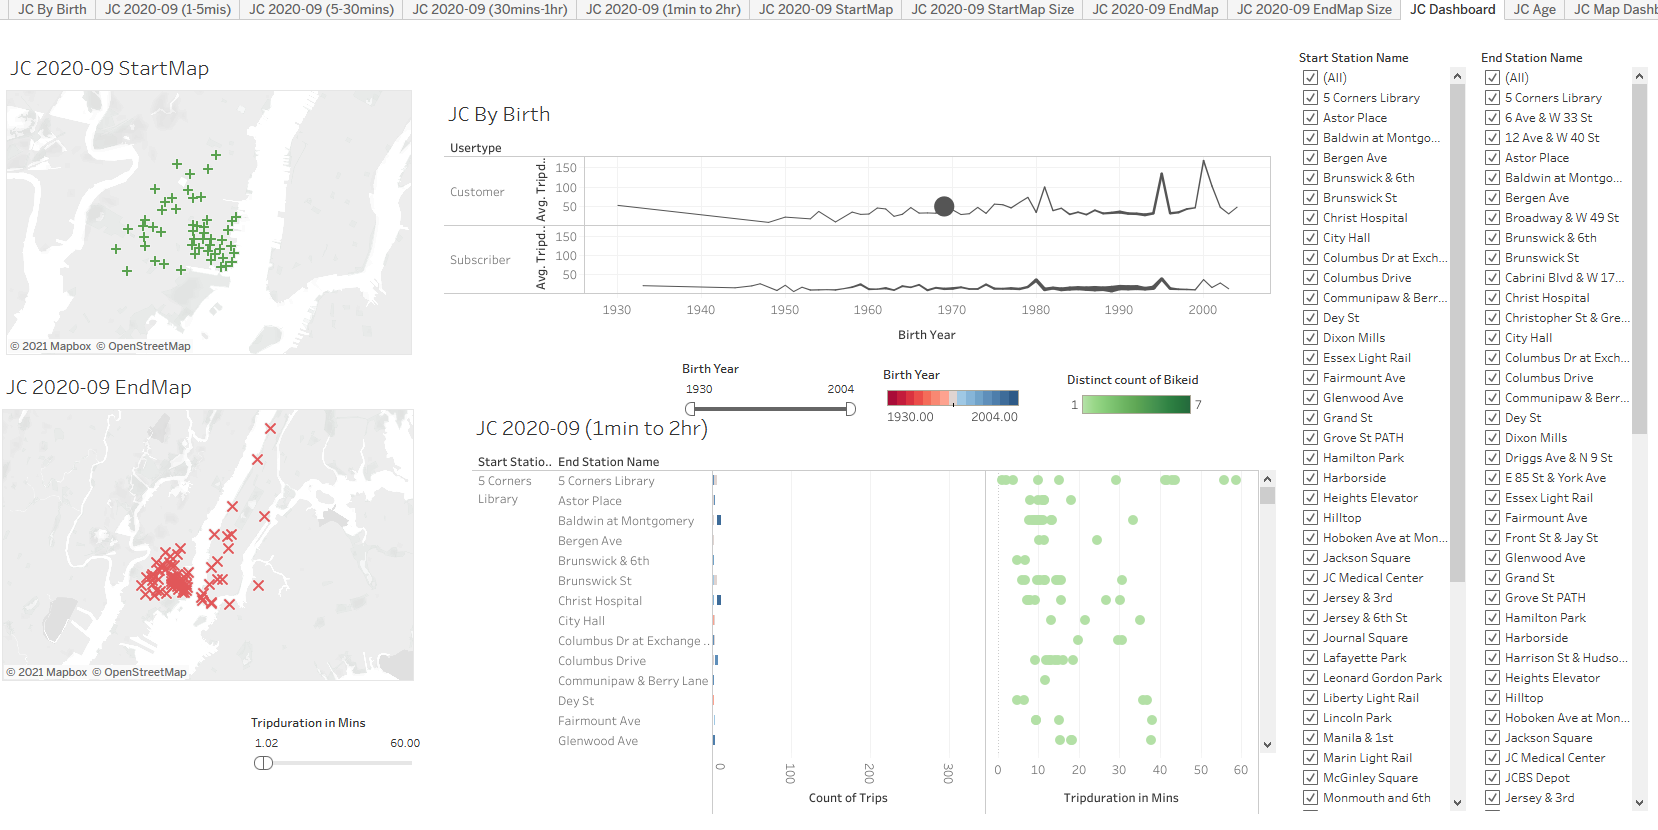
Create a Tableau dashboard for practical real world usage for Jersey Bike Stations.
Skills used: Tableau, GIS
Data Visualization CodePokeTree
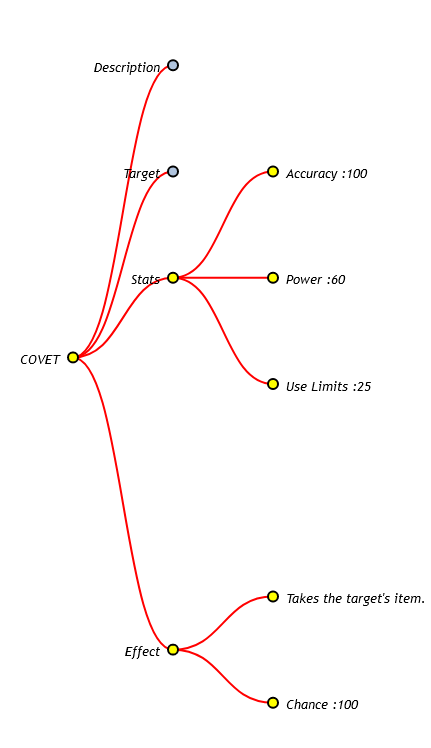
Search a pokemon (all lowercase), a move, skill or an ability and learn about it.
Skills used: ETL from an API using Javascript: D3 library.
Data Visualization CodeWeather Project
.png)
Pull the data from hundreds of cities all around the world and host them on a website.
Skills used: Python (Panda, Matplotlibs, Scipy), API calls, Linear regression, CSS, JavaScript (Bootstraps 4)
Data Visualization Code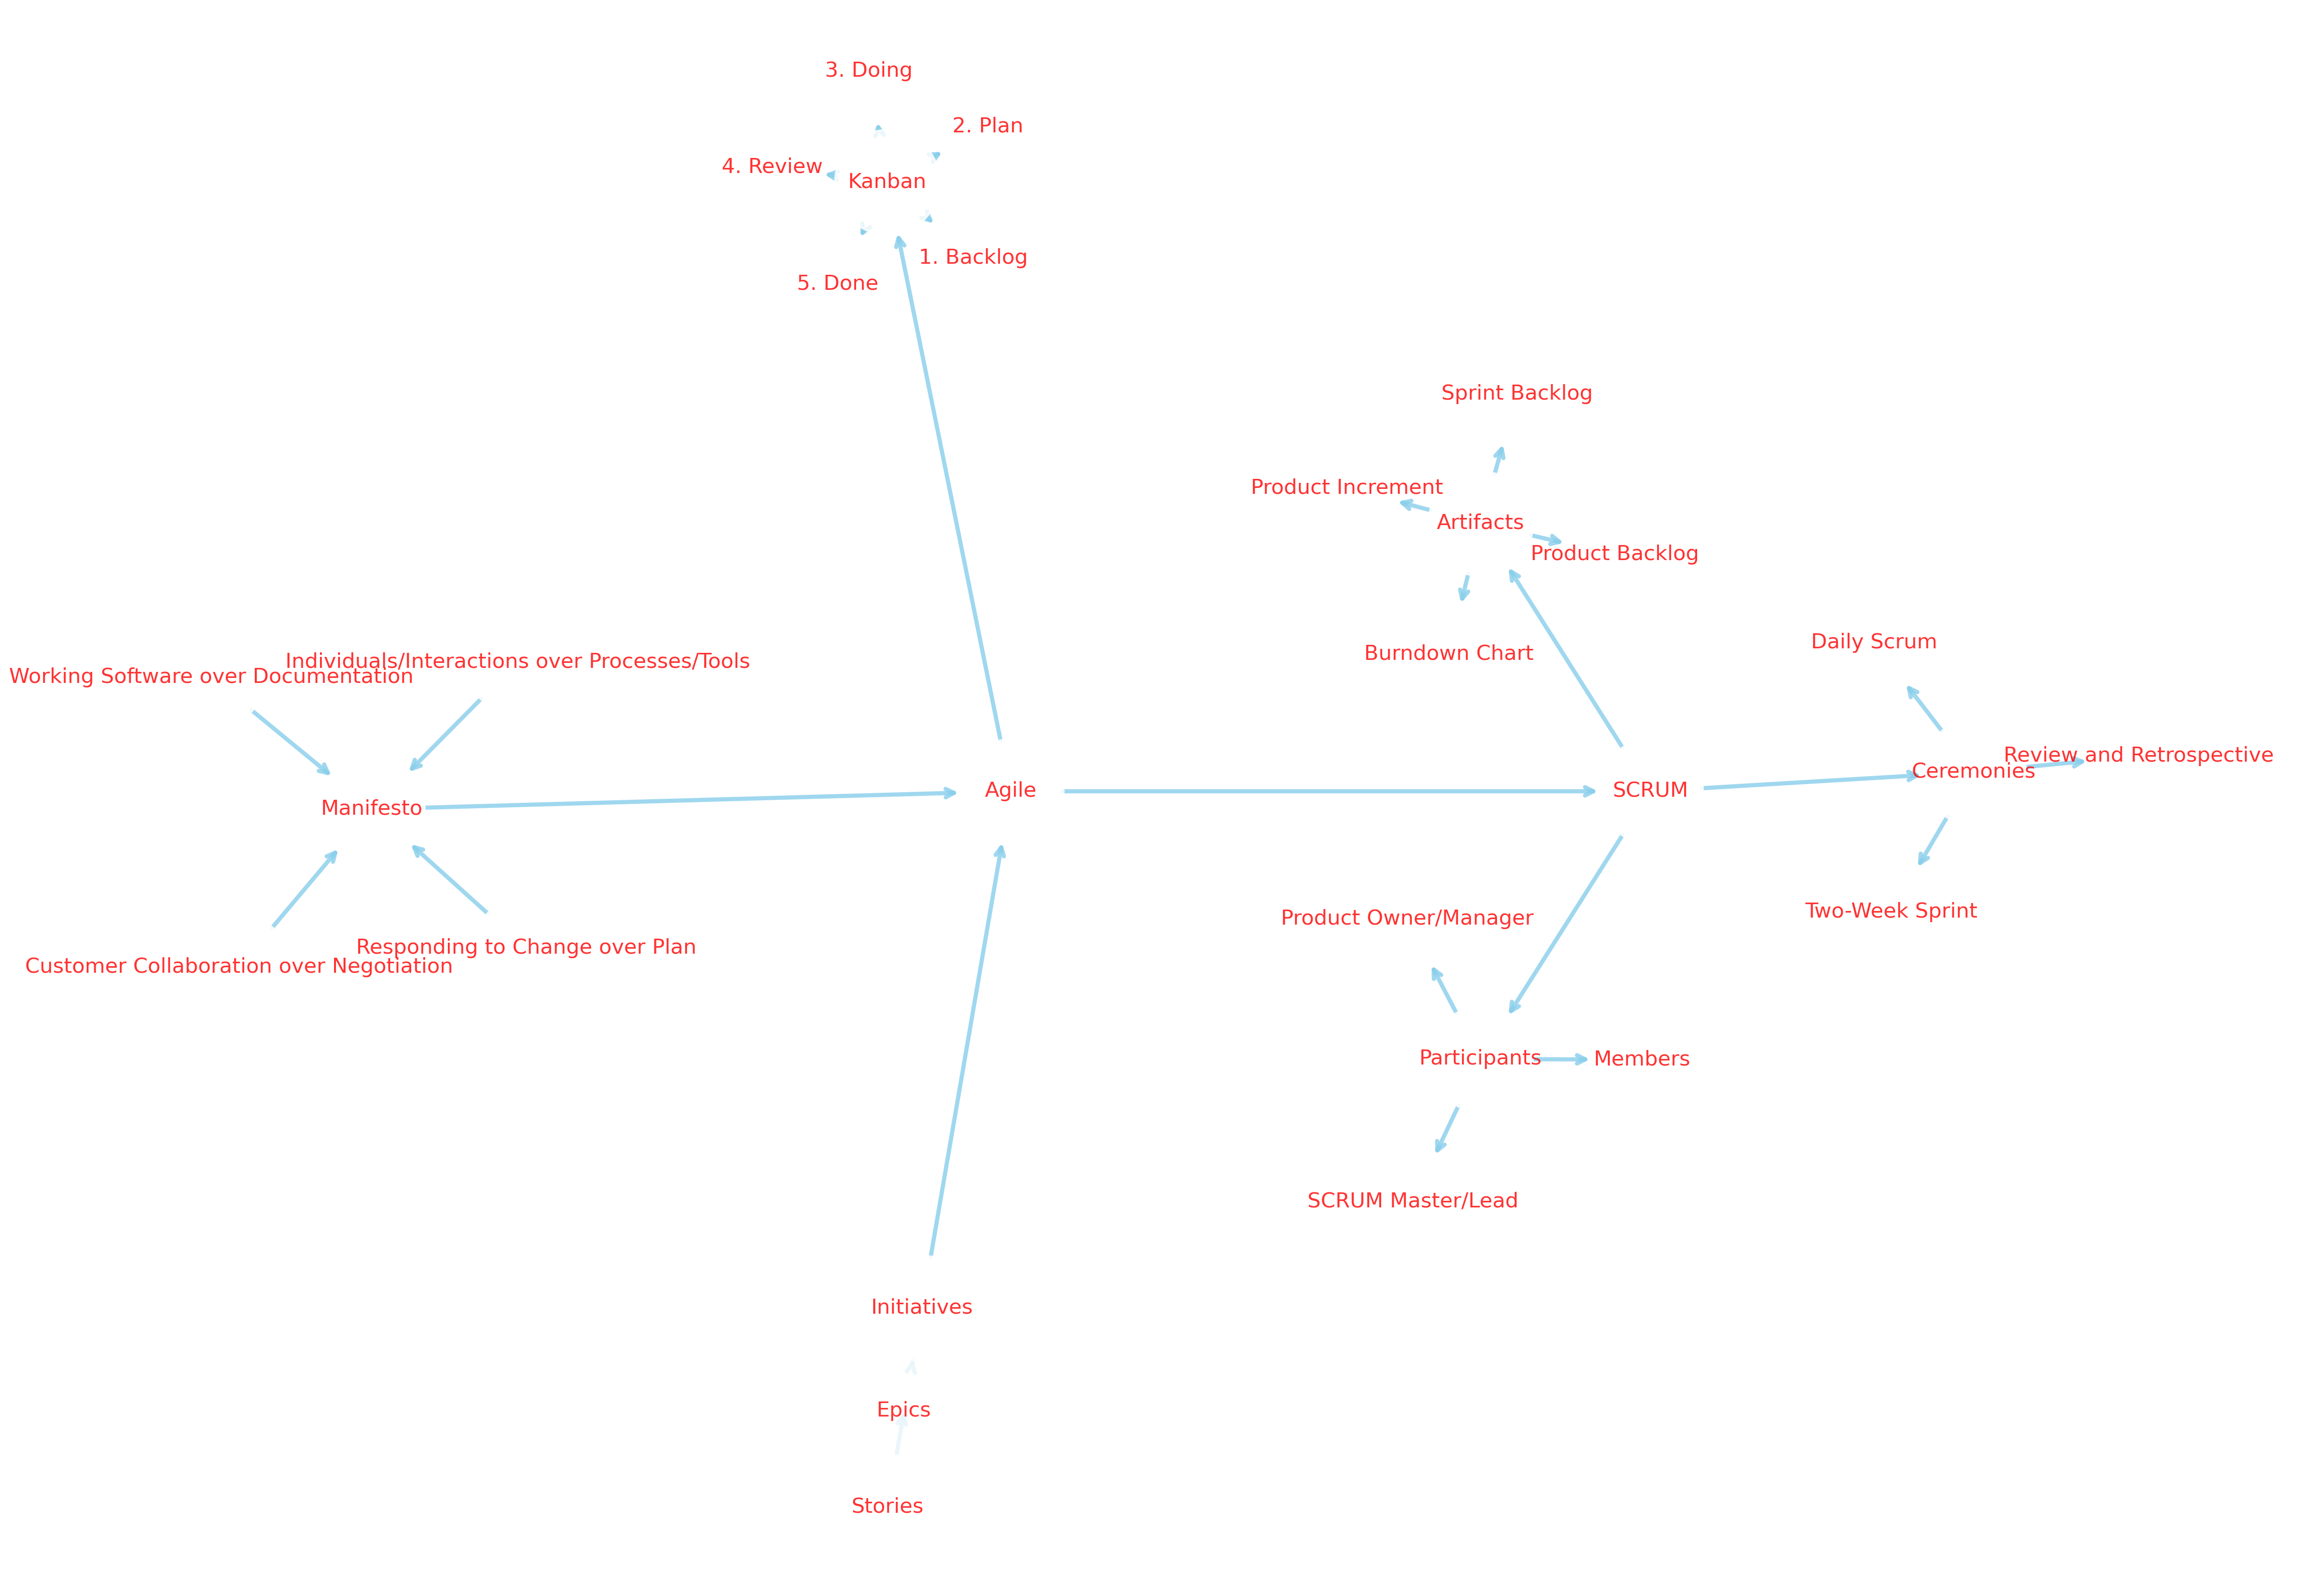
_________________________
Team
Machine-Learning
.png)
Gather loads of data from APIs using Python. Train the Data with a Machine Learning Algorithm. Predicting Whether a Movie Will Ended Up in What Streaming Site. Display both the trained data and the predictions on a Tableau Dashboad and represent the Journey in a Tableau Storyboard. Learn to use SVM (Support Vector Machine) as a machine learning predictor.
Story Dashboards Code Long ExplanationETL Project
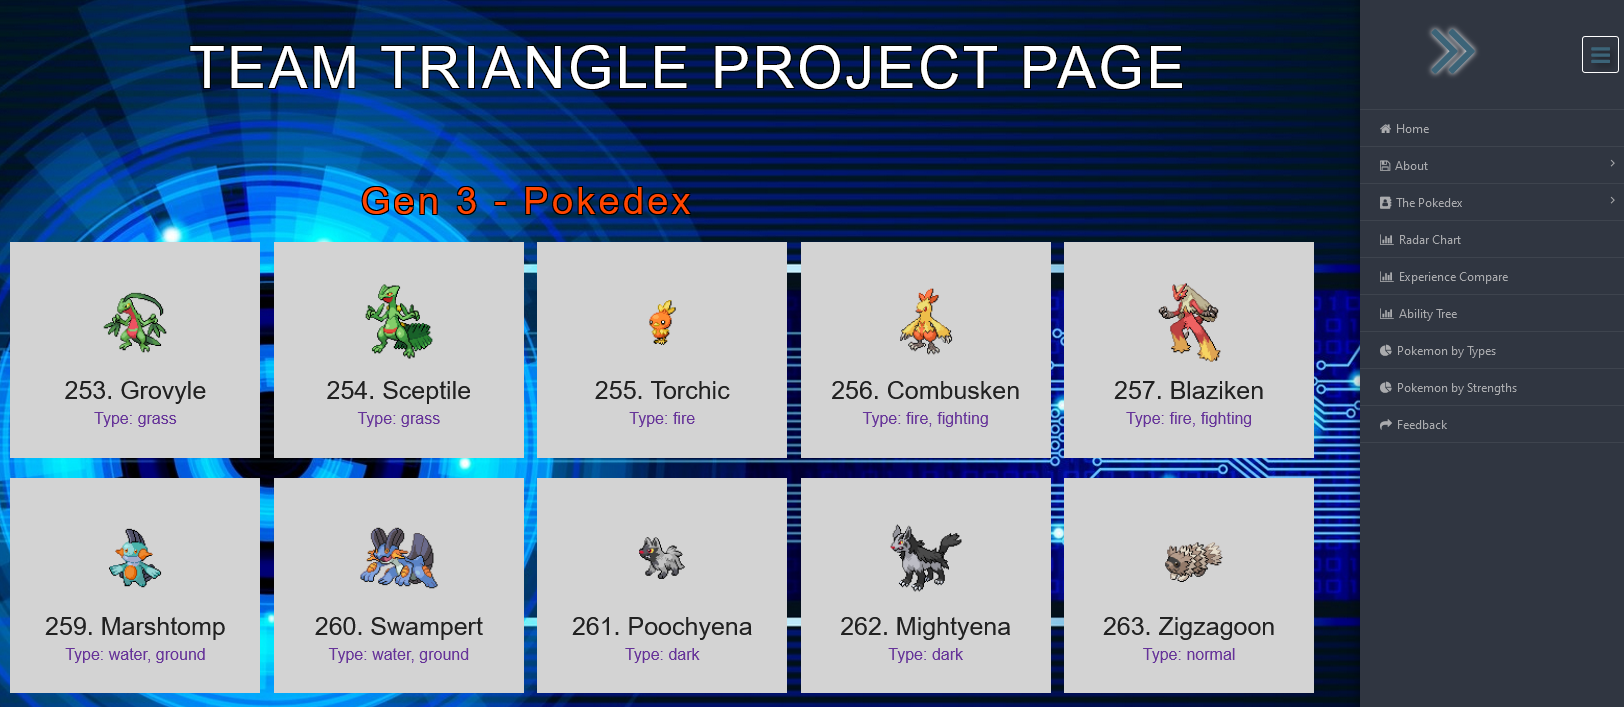
Our four-person team (named after a three-sided object) was chosen by the instructors with an initial deadline of just under 2 weeks to complete. The project(s) on the Git Page were planned, put together, and hosted via Zoom meetings and lots of coffee.
Our Website Code About Project_________________________
Currently Doing
In Progress
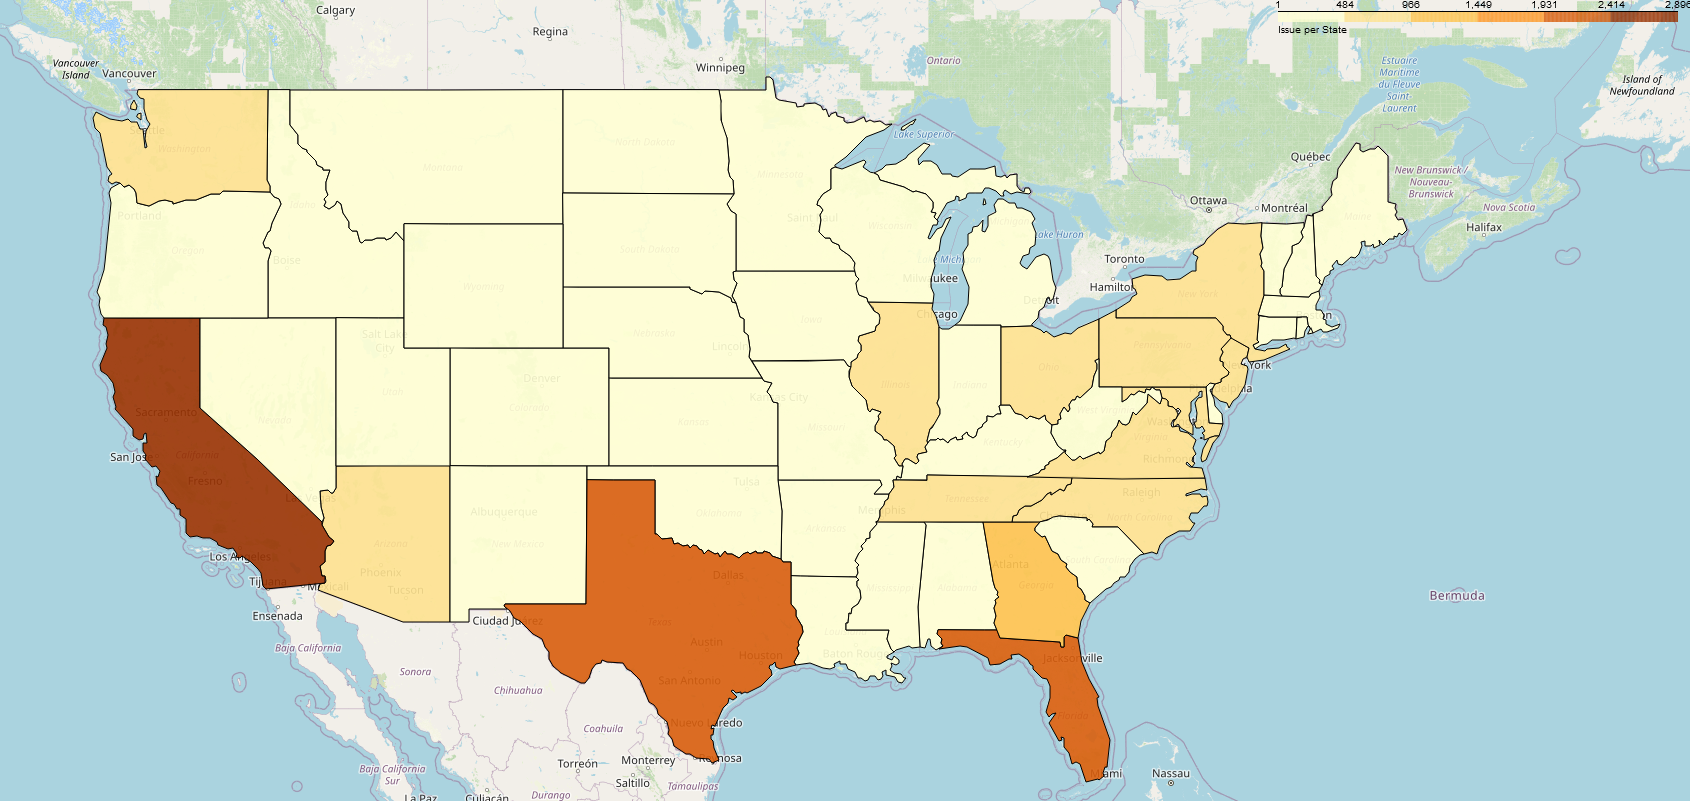
A massive dataset are available from the Consumer Financial Protection Bureau, I decided to play with to use for machine-learning, Chatgpt and learning new skills
Skills used: Pythons (Folium, Seaborn, Panda, Geocoder, Sklearns, Matplotlibs), API calls, GIS. Microsoft PowerBi (expected). Chatgpt prompt
Link to Current CodeContinuous Learning
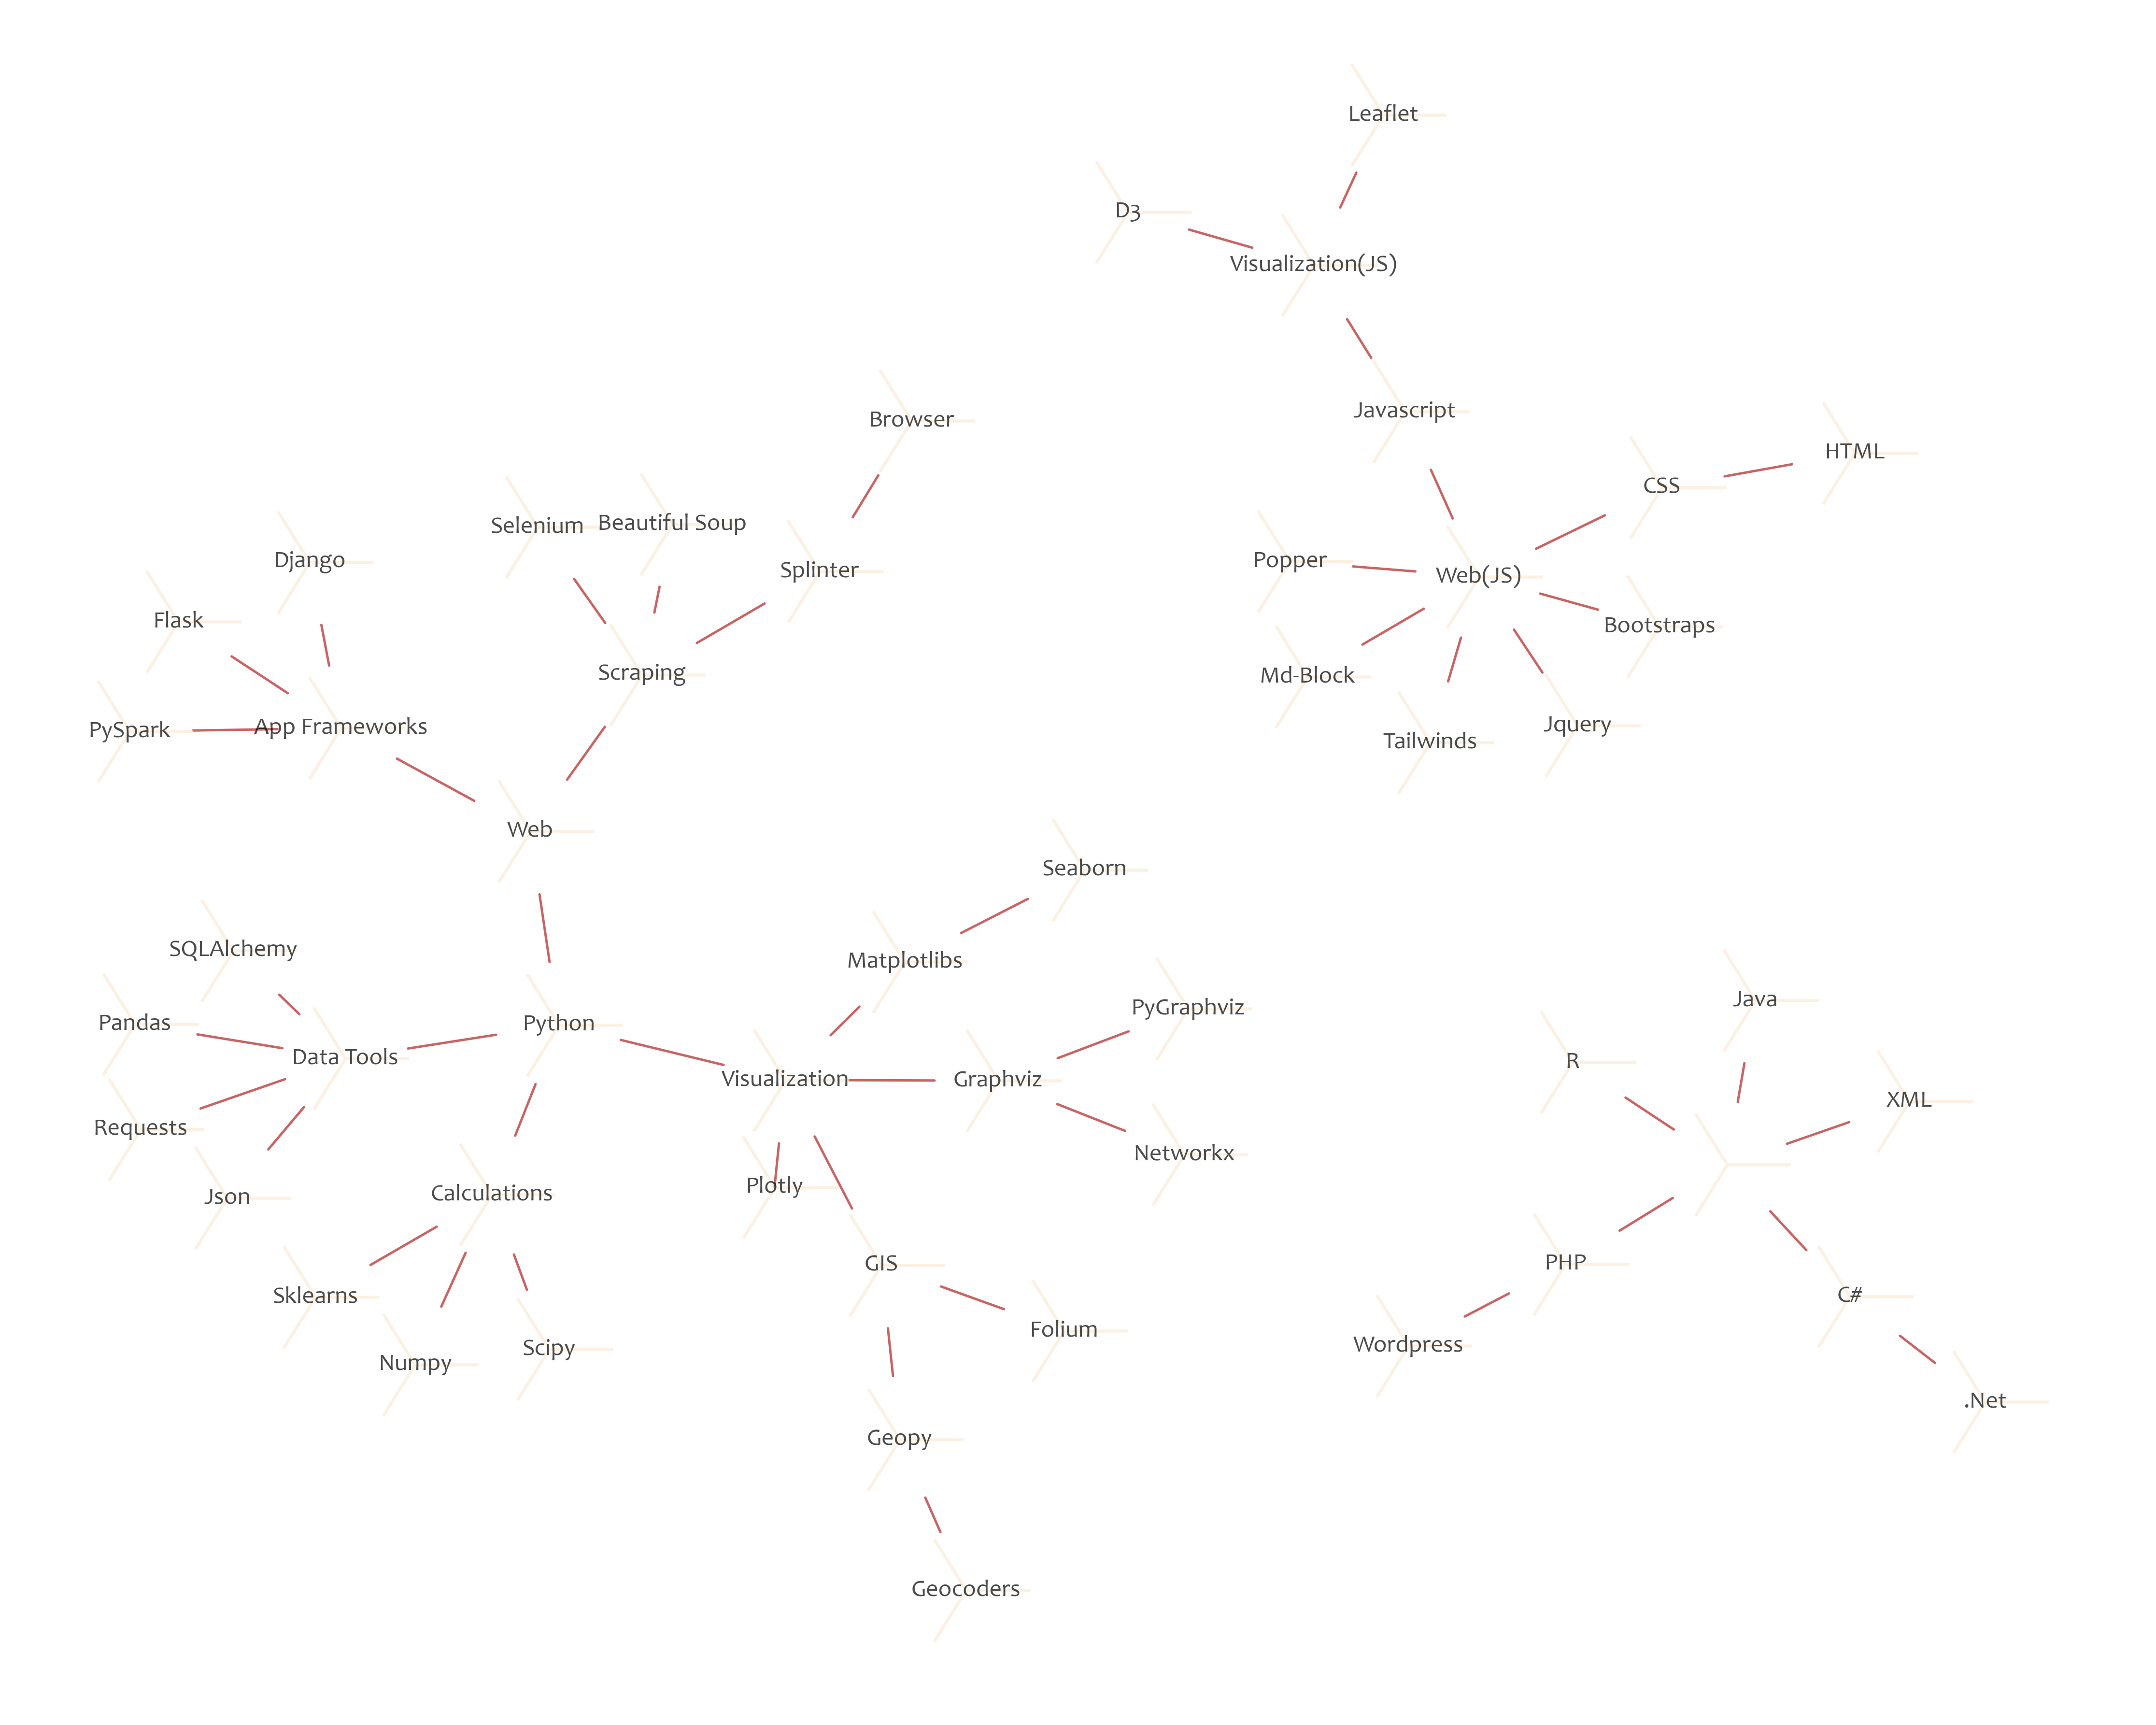
I kept learning new libraries, so this tree and website is a way for me to keep track of it
Skills used: Pythons (Networkx, PyGraph, Graphviz, Matplotlibs)
Skill Trees CodeAndroid App

This is a simple webpage, its mobile interface still feel off, I'm working on it but then I wonder how would it can load into a simple Android app.
Probably easier using an online method, but I rather have a learning opportunity to start developing in Android.
Skills used: Android Studio or Visual Studio, Java, Kotlin or F#
_________________________
Misc
Bootcamp
There are many more projects that I have done in Georgia Tech Bootcamp that I haven' t yet organize or upload to this website. Some dependencies and visualization required liveserver.
Other skills not mentioned: AWS, Hadoop, Flask, NoSql, Mongodb, Sqlite, R, Web-Scraping, Leaflet, GoogleApi, VBA scripting, Postgres..